Dr Paul Nolan is an independent researcher
based in Belfast. He writes on conflict societies, social trends
and demography.
The publication of the
Census 21 data last year proved to be a watershed moment for
Northern Ireland. It showed that on the centenary of the state, a
state established to provide the security of built-in majority for
unionists, the Catholic population had become larger than the
Protestant population.
On 31 May NISRA released a new cache of data which shows how
this dynamic between the two communities is likely to take shape in
the future. There are of course other identities now in play,
adding complexity and unpredictability to the mix, but the main
outlines are plain to see.
The census data was collected on one particular day, 21 March
2021, and is therefore a snapshot in time, a frozen moment. To turn
that snapshot into a moving picture we need to see how religious
identities are distributed across the age cohorts; this allows us
to see the patterns of growth and decline. The picture that emerges
from the new data is a stark one.
While the overall total for those from a Protestant background
is 43.5%, there is a tapering effect as we move down the age
cohorts from the oldest to the youngest. Above the age of 65 the
Protestant share is 59.2% while the Catholic share is 37.9% (not a
huge advance on the 34% it comprised in the first ever Northern
Ireland census in 1926).
At the other end of the age spectrum the ratios are transformed.
In the 0-14 age cohort Catholics make up 48.7% of the population
while Protestants make up just 32.5%. Where is the hinge point?
Because the age cohorts are very broad we can only say with
certainty that it occurs somewhere in the 40-64 bracket, but
extrapolating from the 2011 figures and projecting forward it is
likely that the break point is around the age of 48 or 50.
Above that age Protestants make up the larger population; below
that age Catholics make up the larger population.
The momentum shown in these figures is broadly consistent with
the annual Department of Education School Census which shows that
in the 2022/23 intake Catholics make up 50% of the pupil population
while Protestants and Others make up the remaining 50%.
Differences in the way in which NISRA and the Department of
Education tally up the Other Christian category make it difficult
to make exact comparisons (NISRA gives discrete figures for this
category but brackets them with Protestants, while the School
Census blends them with Others).
The general picture however is clear: over the past decade the
Catholic school pupil numbers have consistently hovered around 50%
very close in fact to t......


")


.jpg?itok=p1WIU24r)


 The
recent and credible bribe allegations against the president could
reveal the truth about the ties between the Biden family and the
FBI.
The
recent and credible bribe allegations against the president could
reveal the truth about the ties between the Biden family and the
FBI.


 Complaints
abound from teachers who send students to the office for serious
misbehavior only to have them return to the classroom
unpunished.
Complaints
abound from teachers who send students to the office for serious
misbehavior only to have them return to the classroom
unpunished. Democrats'
persistence suggests the FBI is poised to peddle selectively leaked
documents to cover up its political favoritism and election
interference.
Democrats'
persistence suggests the FBI is poised to peddle selectively leaked
documents to cover up its political favoritism and election
interference.


 Opposition
to pharmaceutical drugs and industrial food products has grown
organically as each generation finds itself confronted with a
persistent and expanding list of ailments.
Opposition
to pharmaceutical drugs and industrial food products has grown
organically as each generation finds itself confronted with a
persistent and expanding list of ailments.
 The
Washington Post claims using the colors 'red, white, and blue' and
pictures of the American founders is a racist dog whistle.
The
Washington Post claims using the colors 'red, white, and blue' and
pictures of the American founders is a racist dog whistle.
 I emailed the following to Independent Tasmanian MP
Andrew Wilkie and to a number of other members of the Bring
Julian Assange Parliamentary Support Group on the evening of
Monday 12 June, the day before the 13 June resumption of the
sitting of both the House of Representatives and the Senate.
How you can help : Contact your local Member
of Parliament, your state Senators or members of the
I emailed the following to Independent Tasmanian MP
Andrew Wilkie and to a number of other members of the Bring
Julian Assange Parliamentary Support Group on the evening of
Monday 12 June, the day before the 13 June resumption of the
sitting of both the House of Representatives and the Senate.
How you can help : Contact your local Member
of Parliament, your state Senators or members of the 


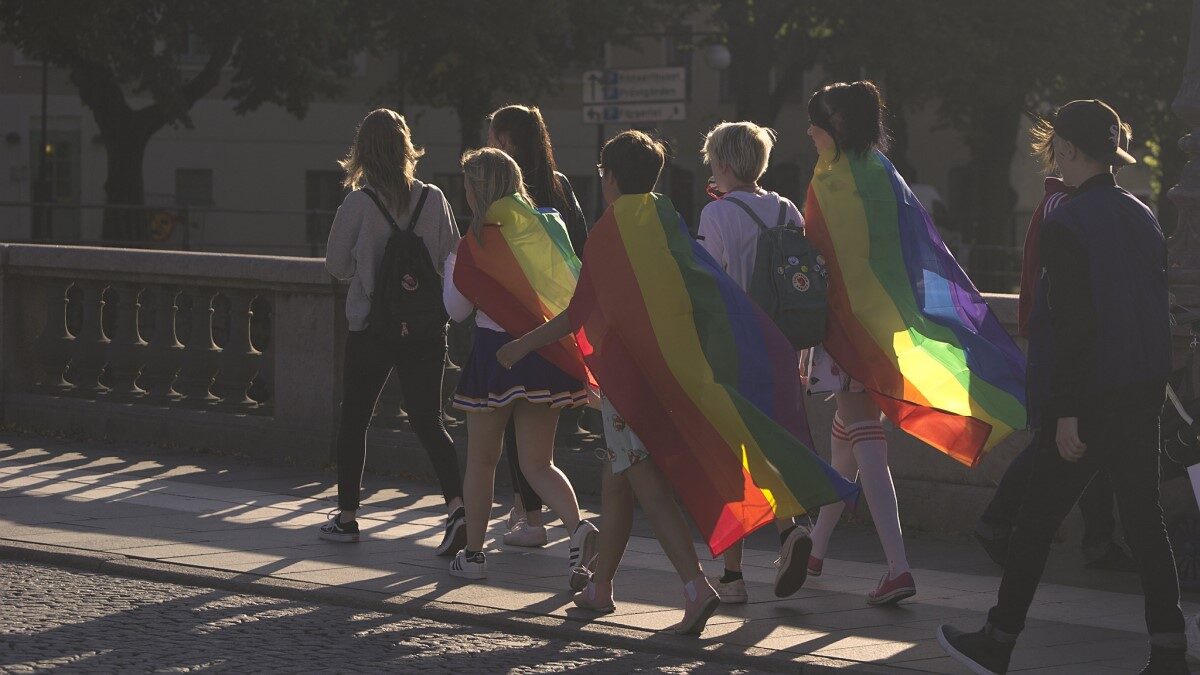 The
Biden administration actually argued that removing books containing
'graphic details of sexual acts' creates a hostile environment for
LGBT kids.
The
Biden administration actually argued that removing books containing
'graphic details of sexual acts' creates a hostile environment for
LGBT kids.
 But
it does require becoming a radical, unapologetic anti-feminist.
But
it does require becoming a radical, unapologetic anti-feminist.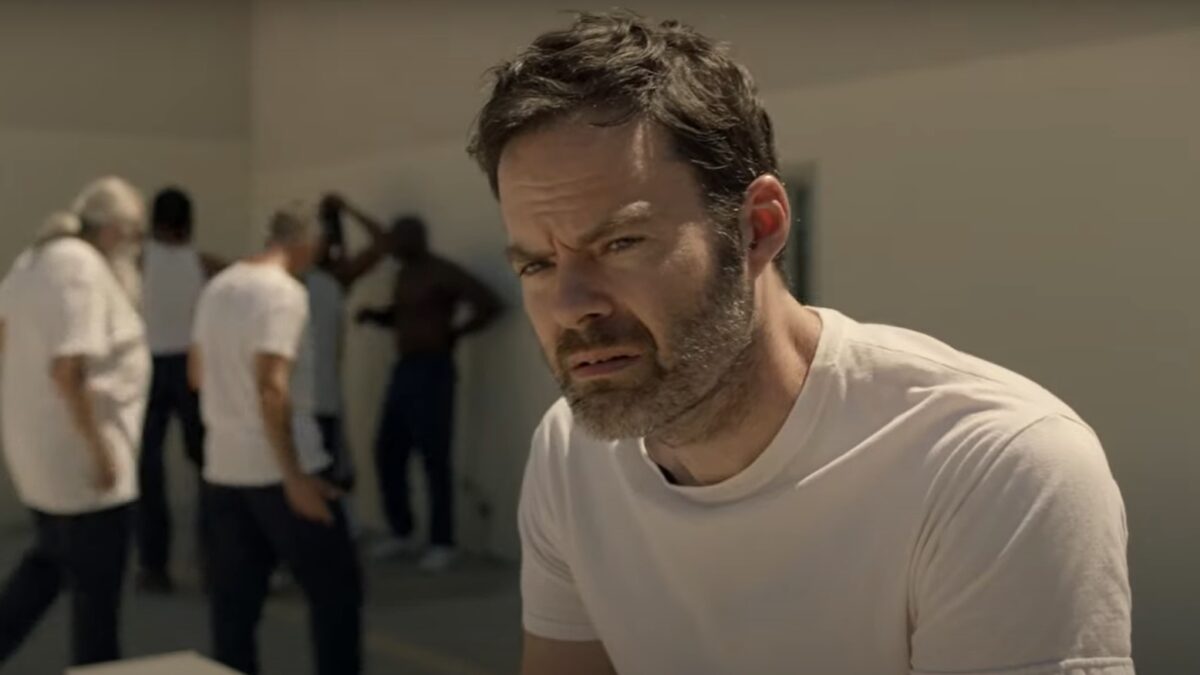 That
a blood-drenched comedy about a hitman, spawned by alumni of
'Seinfeld' and 'SNL' would even hint at the possibility of
That
a blood-drenched comedy about a hitman, spawned by alumni of
'Seinfeld' and 'SNL' would even hint at the possibility of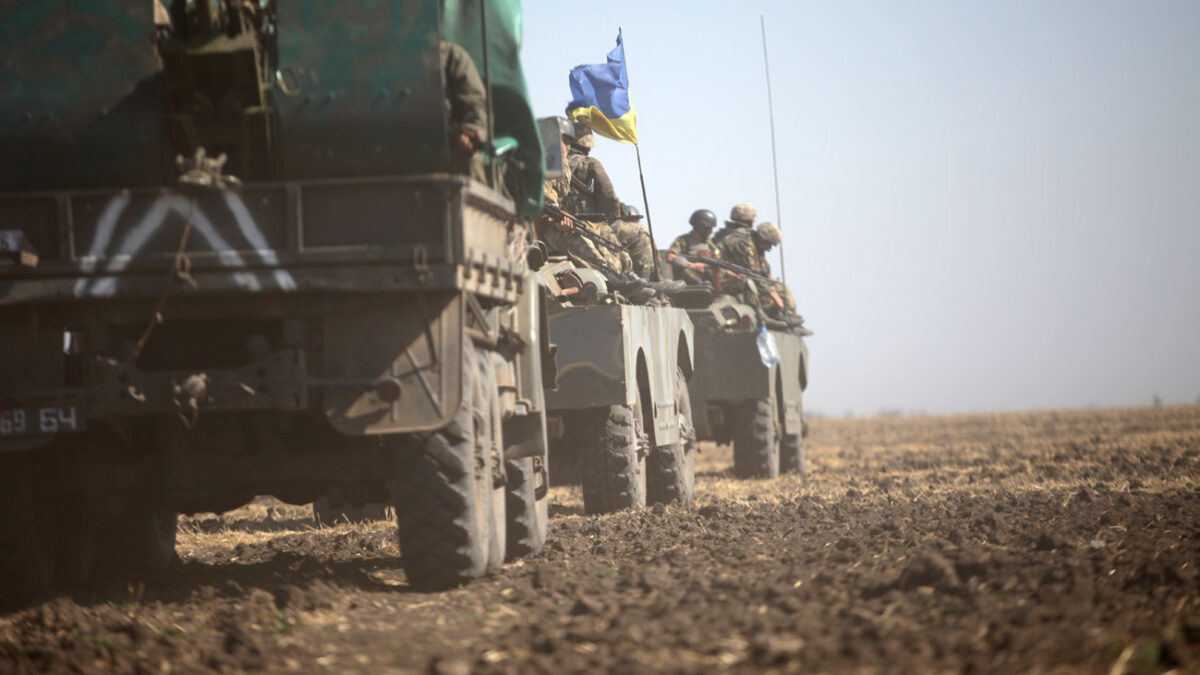 Taking
land wont be the object of the counterattack per se, but rather
destroying the Russian army in Ukraine.
Taking
land wont be the object of the counterattack per se, but rather
destroying the Russian army in Ukraine..jpg)

.jpg)

